
Alice Oswald and Kate Meyer, The Planetary Accounting Network
An Evolving Market
The wine industry, like many others, is faced with increasing market and regulatory demands for evidence of environmental performance. New Zealand’s wine industry has long been a sustainability pioneer, with SWNZ being one of the world’s first sustainability programmes for wine. Today, SWNZ provides a solid foundation for environmental oversight, tracking key environmental indicators. Yet many producers still find it difficult to translate those numbers into decisions, marketing stories, or export evidence. Trade-offs between impacts are complex —say, reducing carbon but increasing water use. Without a scientific benchmark for what “good” looks like, it can be hard to know how to stand out.
Planetary Facts
To address these challenges, BRI partnered with the Planetary Accounting Network (PAN) and 16 other organisations across NZ’s Food & Fibre sector to pilot a new environment assessment and labelling system, developed by PAN, called Planetary Facts.
There is compelling evidence that environmental performance would influence businesses and end-consumers’ purchasing decisions. However, customers can be confused of environmental claims, due to the sheer number of eco-labels on the market (>450), the lack of comparability between labels, the lack of transparency of label criteria, the focus on highlighting positive aspects of a product rather than disclosing the full picture, and the narrow focus of most labels to a single product category.
Planetary Facts, inspired by nutritional labels, were established to disrupt these challenges by disclosing consistent environmental data for any product, in a way that is easy to understand.
Just as nutritional facts show calories, fat and other important health indicators against a recommended daily intake, Planetary Facts show the carbon, waste, and other important environmental footprints against a recommended daily limit, derived from scientific global limits called the Planetary Boundaries.
Planetary Facts labels comprise ten key environmental footprints, grouped under hau (air), whenua (land), and wai (water), with considerations of ora (life) integrated into limits for each of the footprints (Image 1.). The dotted line represents the recommended daily limit; the average per-person environmental allowance for each footprint, which has been derived from the Planetary Boundaries framework. Each footprint is shown as a proportion of this limit, using a traffic-light scale: yellow for impacts within the per-person limit, shifting to red where the environmental impact of that product exceeds the limit per person per day. Regenerative (positive) impacts are shown in green, and here, the larger the green area, the better. For example, the green waste footprint in the example below could represent landfill mining (i.e. extracting waste from landfill as a raw material for this product).
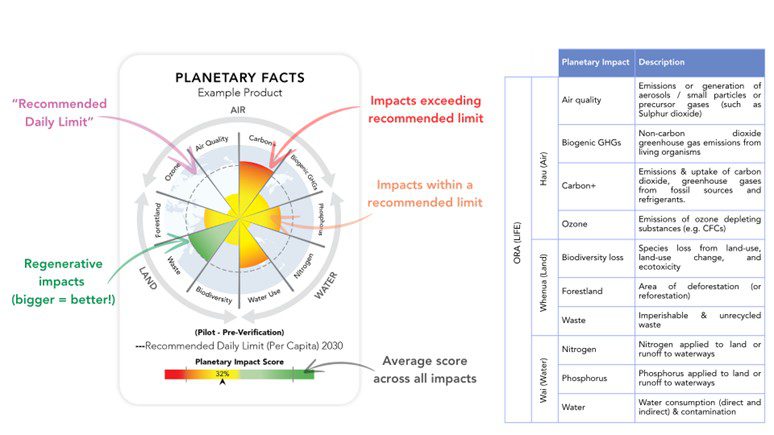 Image 1: Example label
Results are combined into a single Planetary Impact Score — the overall percentage of the total environmental allowance used, offering a simple way to compare overall environmental performance between products.
The first Planetary Facts label was released late 2024, and already, Planetary Facts has been assessed for more than 50 products. Whilst inspired by food labelling, Planetary Facts can be assessed for any product or service, enabling comparisons from chocolate and cheese to housing and transport!
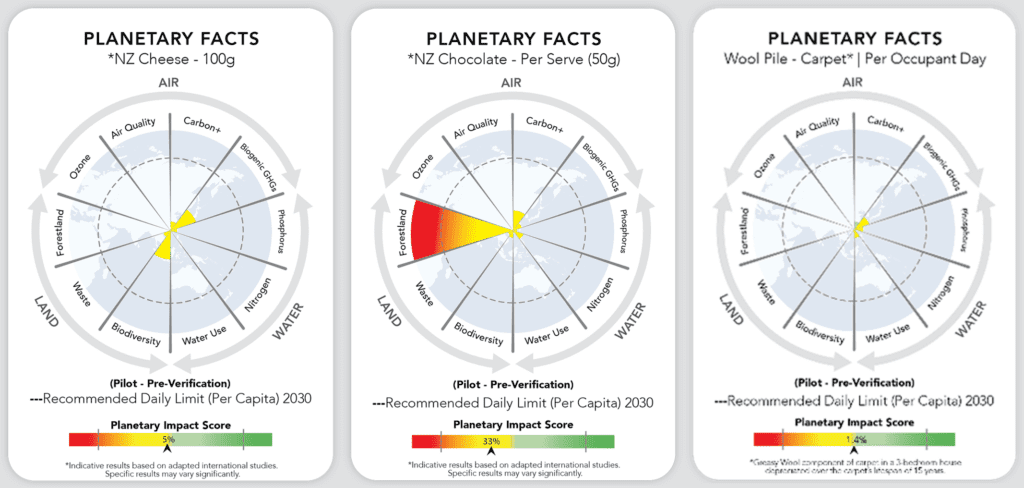 Image 2: Planetary Facts labels for NZ Chocolate, NZ Cheese, and Wool Pile Carpet
Planetary Facts of the typical New Zealand Wine
BRI partnered with PAN to assess the Planetary Facts of wine from Marlborough, Hawke’s Bay, and Central Otago produced in 2024. Aggregated results were used to establish “typical” Planetary Facts of NZ wine (Image 3).
The analysis was undertaken in Planetary Insights software using aggregated SWNZ survey data at the individual vineyard and winery level supplemented with data from published studies such as the National Plant Protection Report, the NZ Wine Annual Report, and an industry study by Clothier & Green (2017).
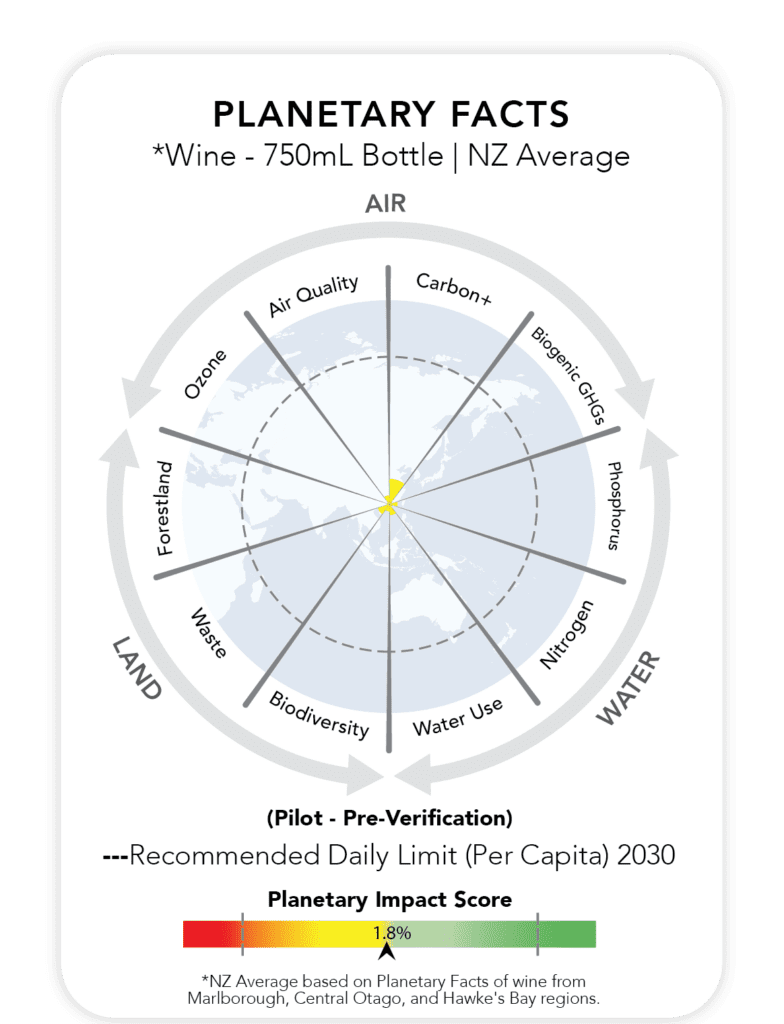 Image 3. Aggregated Planetary Facts for NZ wine, 2024
The Planetary Impact Score of an average 750 ml bottle of NZ wine is ≈1.8%. This means if you share a bottle of wine with your partner over dinner tonight, you would each have ≈99% of a reasonable daily environmental allowance available for your meal and other purchases and activities that day.
Exceeding 100%, essentially indicates consumption beyond an equal-per-capita share of global environmental resources.
Key activities contributing to the Planetary Impact Score were:
- Carbon+ (6.7%) – packaging, shipping, and winery energy use;
- Waste (2.6%) – distribution, glass bottle production and waste to landfill from winery operations;
- Water (2.4%) – vineyard irrigation (70%) and glass production;
- Phosphorus (1.9%) – electricity generation and packaging materials;
- Air Quality (1.7%) – due to emissions of air pollutants associated with distribution, manufacturing of packaging materials and energy use across wine wineries;
- Biodiversity (1.7%) – due to impacts on biodiversity from the manufacture of fuel and other resources associated with shipping, the manufacture of glass, and land use for vineyards.
From a life-cycle perspective, distribution accounted for 42% of the total environmental impact, followed by packaging 31%, winery operations 14%, and vineyard activities 12%. The high impact from distribution was primarily from sea freight for exports, while packaging impacts were largely driven by the production of glass bottles. Winery-related impacts stemmed mainly from energy used in wine production and storage. On the vineyard, the main contributors were fuel consumption, irrigation, and land use.
Regional Results
The regional Planetary Facts showed significant variation between the three regions in both the scale and shape of impacts. On average, Marlborough wines had the lightest footprint with a Planetary Impact Score of 1.6%, with Hawke’s Bay at 3.7%, and Central Otago at 4.4%.
The most significant impact for Marlborough and Hawke’s Bay was carbon+ (i.e. the emissions and uptake from carbon dioxide and greenhouse gases from other fossil sources). However, Central Otago’s highest impact was water use, at 14% of the recommended daily limit. Central Otago and Hawke’s Bay had higher biodiversity impacts than Marlborough due to lower yield (i.e., higher land-use per output of grapes) in these regions.
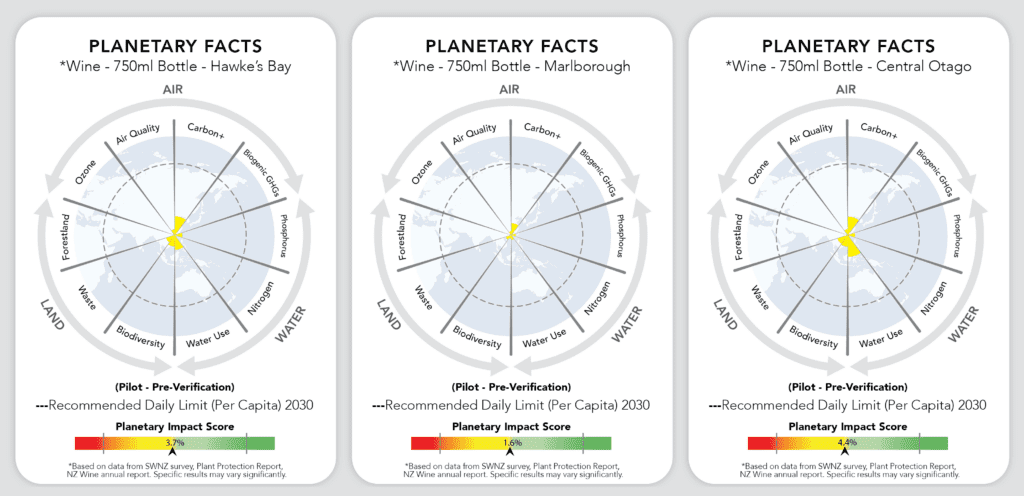 Image 4. Planetary facts assessment of three New Zealand winegrowing regions
However, the variation between the regions highlights the need for Planetary Facts at the brand, variety, and vintage levels, as the range in Planetary Impact Scores between brands will significantly exceed the variation between regions!
What this means for wine
For NZ producers and growers, Planetary Facts offer both a risk management tool and a brand advantage. With rapidly shifting markets and regulations, Planetary Facts provides a credible, science-based framework to meet these expectations while giving consumers and trade partners confidence in the integrity of NZ wine.
A glass of wine constitutes a seemingly small proportion of a daily environmental budget. However, our daily impacts are the summation of many small contributions, and are currently exceeding environmental limits. So, the wine industry, like every industry, must continue to minimise environmental impacts and work towards regenerative practises.
There may be limited opportunities for the wine industry to influence the impacts of international distribution in the short term, however, more than 68% of impacts are within their direct control or influence. Key opportunities to reduce the environmental footprint of wine include:
- More environmentally friendly glass, less glass bottles and/or alternative packaging solutions to reduce both glass and distribution impacts (which are relative to weight);
- Waste reduction through operations and supply chain engagement to identify opportunities to increase circularity;
- Energy efficiency initiatives in wineries;
- Electrification of vineyards, wineries, and transport; and
- Incorporation of agroecology principles into vineyards to improve soil health and biodiversity whilst reducing reliance on synthetic pesticides and fertilisers through cover crops, agroforestry, and/or livestock.
However, the relative importance of these opportunities, and other specific opportunities for improvement will vary significantly between brands. In all cases, Planetary Facts help to manage trade-offs to avoid impact shifting (e.g. to show if and when incorporation of agroforestry would generate a positive outcome if it reduces yield).
Further studies would be needed to establish the viability of regenerative wine, i.e. wine that has a net positive impact on the environment, which is indicated by a negative Planetary Impact Score. However, Planetary Facts provides the data and insights needed to determine both the feasibility and the roadmap.
From environmental data to market advantage
The Planetary Facts assessment provides a market opportunity to showcase the overall performance of brand New Zealand wine. The results show that there is variation in performance between regions, which indicates that there will be an even greater variation between brands.
It also shows that there are opportunities for environmental enhancement on vineyard, through production, packaging, and distribution. Initiatives such as alternative packaging solutions, enhanced water efficiency, waste reduction, electrification and energy efficiency, and agroecology practices are key levers for environmental enhancement, and may enable a transition to nature-positive wine.
With the strong foundations of SWNZ, New Zealand is ready to lead the way in environmental performance transparency, as a global leader in sustainable wine production, setting an example for other industries to follow.
Planetary boundaries are an internationally recognised scientific framework to describe limits to the impacts of human activities on the Earth system. The Planetary Accounting Network (PAN), a New Zealand based charitable trust, has designed an initiative to assess the environmental impact of a wide range of products. Alongside a range of New Zealand primary sector groups, and leveraging MPI funding, Bragato Research Institute (BRI) engaged with PAN to undertake a Planetary Facts Assessment for our three largest wine regions, using Sustainable Winegrowing New Zealand (SWNZ) data. The assessment aims to introduce New Zealand wine businesses to the system, helping them to quantify, compare and communicate the environmental performance of wine production relative to the global Planetary Boundaries.