
Grape Yield Analyser Programme: Could you assist by providing data?
Rob Bramley1, Mike Trought2 and Will Kerner3
1CSIRO, Adelaide, Australia; 2Fellow, New Zealand Wine; 3Bragato Research Institute, Marlborough
The core focus of the Lincoln Agritech-led grape yield analyser (GYA) programme is to develop a sensor-based technology that will provide accurate post-fruit set predictions of grape yield at harvest. The GYA aims to provide yield estimates on a block level. The analyser is being developed in Marlborough, but if successful it will be able to be used in any of New Zealand’s wine regions.
A key question to be answered in the development of the GYA is, where should it be deployed? This is an important question as it’s not possible to deploy a single sensor in every vineyard at the same time! The question therefore arises as to whether a yield prediction made in one vineyard can provide useful information about the likely yield in another? As a part of the GYA research, we are trying to address this question and are using some work done recently in the Australian sugar industry to guide us.
Figure 1a shows a map of the maximum yield of sugarcane grown over the period 2009-2015 in the Herbert River region, centred on the town of Ingham, in North Queensland. In this region, which covers about 70,000 hectares, all of the sugarcane grown is delivered to one of two sugar mills, both of which are owned by the same company. At the mill, every bin of cane is weighed, and the sugar content analysed, as a means of then determining how much the grower should be paid for their crop. The sugar mill can therefore be viewed as a kind of yield monitor; and in the Herbert River district yield records for around 12,500 blocks are collected each year. (The reason that the maximum yield of sugarcane achieved over this 7-year period is displayed in Figure 1a is that this is used as a surrogate measure of potential yield, a key input to the fertilizer recommendations for sugarcane production.). In Figure 1b, yield maps obtained using the same sugar mill data for each individual year in the 2009-2015 period have been clustered together using a statistical algorithm to identify ‘zones’ of characteristic yield performance. This approach is very similar to that used by adopters of precision agriculture or precision viticulture in identifying zones in their fields or vineyard in which targeted management might be appropriate, such as variable rate fertilizer application or selective harvesting and product streaming.
Sugar mills and wineries are similar inasmuch that both are places which record crop yield as a basis for paying growers. However, whereas in the sugar example, the data only had to be collected from one company, in Marlborough there is diverse ownership of both wineries and vineyards. As part of the GYA programme, we are hoping to use data collected by wineries and other industry members to generate maps of production in the Marlborough region, similar to those shown in Figure 1. If we can identify parts of the region that have similar characteristic production, then deploying our GYA sensor in one or two of these sub-regions may promote an ability to make sensible inferences about likely production in others. In addition, superimposing the yield maps on other regional characteristics (e.g. inflorescence initiation and flowering temperatures, soil fertility levels and water availability) may lead to a better understanding of sub-regional parameters controlling vine yields.
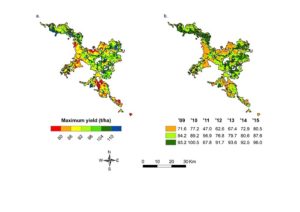
Figure 1. Variation in sugarcane yield in the Herbert River region of north Queensland, 2009-2015. In (a) the maximum yield achieved over this 7-year period is shown, whilst in (b) the data from individual years have been clustered to identify areas of similar performance. The numbers in the legend to (b) are the annual mean yields in each zone. Note that even though these vary from year to year due to seasonal conditions, the pattern of yield variation is stable in time.
Thus far, six wine companies have contributed data to the program, and this has enabled us to produce the maps shown in Figure 2. It is important to note that, even though the data were derived from individual vineyards, because these maps are interpolated surfaces, they do not convey any information that can be tied to an individual block or producer. However, whereas the sugar maps (Figure 1) were underpinned by around 12,500 data records per year, the maps shown in Figure 2 are currently derived from fewer than 500 vineyard blocks. Figure 2 is a good start and suggests that what we are trying to do may be useful, since it does convey a discernible pattern in the data. However, a key part of this work is to see whether the patterns of variation in yield and its components (e.g. bunch weight, berry weight) are stable from year to year. This is important because if they are, it will enable us to focus on particular locations when estimating future yield, knowing that these locations are characteristically average yielding, or perhaps always in the top 5% of highest (or lowest) yielding vineyards. It will also enable industry to identify regions exhibiting greatest seasonal differences in yield and yield components. Figure 2 is suggestive that in terms of harvest date, there may be a characteristic pattern, but in terms of yield the results are somewhat uncertain, most likely because we need to produce more robust maps.
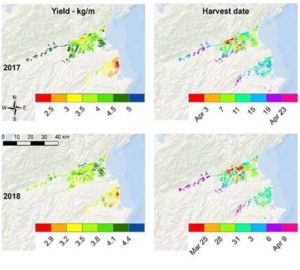
Figure 2. A preliminary analysis of yield variation and harvest date in the Marlborough wine region in 2017 and 2018.
To produce more robust maps, we need more data! If you would like to help with the development of the regional GYA maps, by providing yield and yield estimation data, please contact Will Kerner, vineyard ecosystems program manager at the BRI.
We are especially interested in data records from individual vineyard blocks from vintage 2014 onwards, for yield at harvest, date of harvest, and any additional information on yield components. No data will be passed to any third parties or used for any purpose other than this mapping exercise; all those who contribute data will be provided with copies of the resulting maps.
Once again, if you are willing to help with this important project by contributing data, please contact Will Kerner, Vineyard Ecosystems programme manager at the BRI.
Acknowledgments
This work is being been jointly funded by CSIRO, Plant and Food Research (PFR) and the New Zealand Ministry of Business Innovation and Employment (MBIE) through an ‘Endeavour grant’ provided to Lincoln Agritech Ltd (‘A sensor and model-based analyser for blockscale grape yield prediction’; MBIE contract LVLX1601). We are most grateful to Pernod Ricard, Delegat Wines, Villa Maria, Wither Hills, Whitehaven and Constellation Brands for contributing data to this project.