

Development of Grape Yield Analyser continues to progress
Now in its fourth year the Grape Yield Analyser (GYA) research programme aims to develop sensing technology and tools to enable accurate harvest yield predictions early in the growing season.
The new technology will help inform vineyard management decisions by providing advanced data-based yield predictions. Site-specific yield prediction (targeting block-level, eventually down to the row-level) will allow easier assessment of potential yields with the chance to more accurately manage yield variability across vineyards.
The GYA yield-prediction technology uses a sensor system and a predictive mathematical model to predict the potential yield at harvest. GYA combines optical sensing (digital camera-based) and microwave (radar) sensing, to determine bunch number and mass on the vine in mid-December & January. The predictive model uses data from the sensing system, historical yield data, provided by winegrowers, and measurements of vine physiology. It can be characterised as a continuous learning tool (e.g. with the input of new data annually) using Bayesian Modelling framework.
In January 2020 a winegrower focused seminar was held in collaboration with the Bragato Research Institute at the Marlborough Research Centre in Blenheim. The seminar provided an update on project development and discussion around the pivotal role of winegrower supplied yield data in delivering effective outcomes for the GYA programme.
The presentations and discussions showed how grower’s data helps with advancing the predictive model to assess potential grape yield early in the season; and how stable patterns of spatial variability of harvested grape yield are being derived within the Marlborough region.
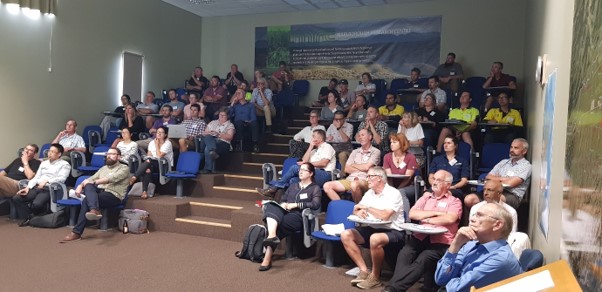
Attendees at the GYA seminar in Marlborough.
The following articles summarise the different aspects of the project that were presented during the seminar. They focus on the development of the yield sensing tool and supporting models.
Optical sensing to support yield analysis
The machine vision team at Lincoln Agritech have been charged with developing a sensor-based tool that can be used to determine bunch number and mass on the vine.
This season the machine vision team is focusing on three tasks;
- automated (camera-based) inflorescence counting,
- a novel tool for estimating phenological stages in flower development,
- a sensor for early bunch growth estimation.
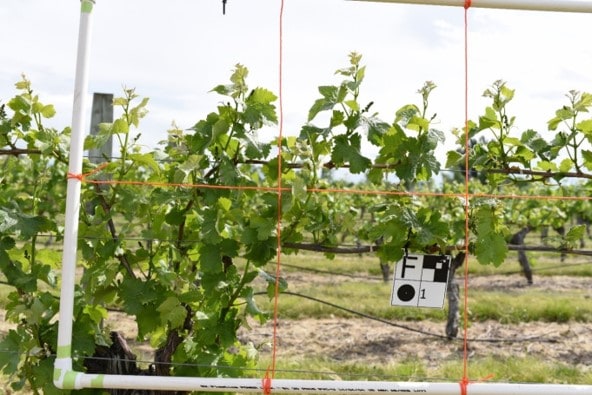
To estimate early season bunch size the team have combined a digital camera and directed airflow. Occlusion from leaves (bunches covered by leaves) in the canopy contributes significantly to the uncertainty of grape bunch counts. Directed airflow moves the leaves that occlude bunches, allowing the digital camera to clearly photograph the bunches.
In November 2019 a prototype of the sensing tool was deployed in a Marlborough vineyard. Images of inflorescence were captured from 100 bays.
A deep learning algorithm, an artificial intelligence tool, is currently being developed to automatically identify and count inflorescences in the images (Image 2). This data is added to from high resolution close-up images of inflorescences. The percentage of “open” (uncapped) flowers is determined from the high-resolution images, this information relates to the growth stage of the inflorescences and gives an indication of potential berry number.
By combining directed airflow with digital cameras, the team at Lincoln Agritech have created a low-cost sensing system that will hopefully lead to early season yield prediction.
Identification and accounting of inflorescence.
Bayesian Grape Yield Prediction Model
Prof. Elena Moltchanova, Dr. Daniel Gerhard and PhD Candidate Rory Ellis, members of the statistics and mathematics team at the University of Canterbury have been developing a Bayesian modelling framework that will develop support data collected from the sensing system.
At the end of the project the predictive mathematical model will use data provided from the yield sensor to predict the potential yield at harvest. The model has been developed using historical data on bunch development at various time points to predict the bunch weight expected at harvest.
The Bayesian approach mimics human natural learning process; every time a new piece of information is obtained, we update our understanding of the phenomenon in question. As a result, there is no need to wait until all the data are collected, and there is no need for the data to be in the same format or come from the same source.
The model will combine bunch counts, yield sensor outputs, phenological and weather data to produce an estimate for the average grape bunch weight. This will be combined with the estimates for the number of bunches per vine to obtain the final yield estimate for the vineyard as shown in Figure 1.
It is envisioned that once the prototype is ready, a cloud-based app will be developed, which will allow users to anonymously upload their data and obtain continuously updated predictions.
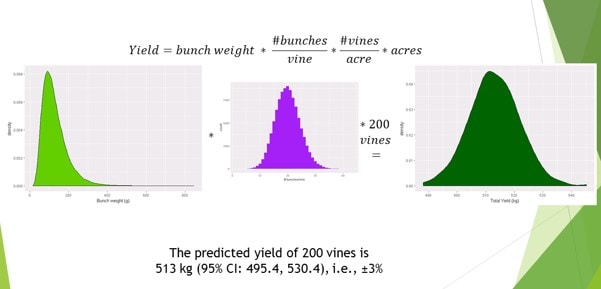
Figure 1: Combining prediction for grape bunch yield with the prediction for the number of bunches per vine to obtain the final yield estimate for a small vineyard of 200 vines with an average 20 grape bunches per vine.
Within vine variability in bunch number and size
Members of the viticulture and oenology team at Plant & Food Research, Julian Theobald, Damien Martin, Mike Trought, Sue Neal & Andrew McLachlan, have been researching within vine variability of bunch number & size.
To assist in the development of the yield sensing tool and Bayesian Model, research on the within vine variability in bunch number and size was undertaken.
In the first season (2018-19), it was found that bunch number and total mass of bunches per shoot were significantly different and proportionally lower at higher leaf node position (LNP) locations. These results inform yield modelling as both bunch size and potential bunch number are strongly and significantly related to the LNP count of the basal bunch.
Early season detection (4-6 weeks post budburst) of the mean LNP insertion point of the basal bunch is thought to be a significant input variable for refining early-season yield prediction.
A second season’s data collection is underway to substantiate if positional effects on bunch number and size are stable over time, and whether there are any differences in response between 2- and 4-cane pruned vines It will also be of interest to analyse these data alongside historical datasets that suggest that factors that dictate the LNP position of the inflorescences could contribute to sub-regional and inter-seasonal variations in yield. The data would also seem to support the hypothesis that cane node position (CNP) plays a minor role in yield variation of 2- or 4-cane pruned vines, which may simplify the development of early-season yield prediction tools for cane pruned vines.
Progress in mapping regional scale variation: Do you have data that may be useful?
Rob Bramley at CSIRO Adelaide has worked in collaboration with Mike Trought and Will Kerner of Plant & Food Research and Bragato Research Institute, respectively, to map regional variation in yield.
In the November 2019 edition of this newsletter, we described work to map regional scale variation in the yield of Sauvignon Blanc. The work, part of the grape yield analyser (GYA) programme, aims to provide industry with information on areas of similar yield within sub-regions so that a yield sensor may be efficiently deployed.
In previous research on cane pruned Marlborough Sauvignon Blanc, it was shown that at the within-vineyard scale, variation in vine vigour shows marked patterns. These patterns are stable from year to year and are related to underlying variations in vineyard soil and topography. In contrast, within-vineyard yield variation appears to be random and unrelated to variation in vine vigour, soil type or topography. So a relatively high yielding vine one year might be relatively low yielding the next year, even though its vigour and fruit quality might be quite similar, relative to the block average, from year to year. These results suggest that it doesn’t matter where the yield prediction sensor is deployed within an individual vineyard, so long as it gives a representative picture of the block.
At the regional scale, the story is a bit different. In this case, we want to know whether a yield prediction made in one location can provide useful information about the likely yield in another. Aside from making deployment of the yield prediction sensor manageable, this will be valuable to those who want to know about the predicted yield in a range of locations.
In the November newsletter, we presented preliminary maps of yield and harvest date in 2017 and 2018. In each case, the maps derived from around 450 vineyard blocks and as a result, they were of low resolution. Since then, we have been pleased to receive more data. At a recent workshop held at the Marlborough Wine Research Centre, we presented the results of regional mapping using the larger dataset.
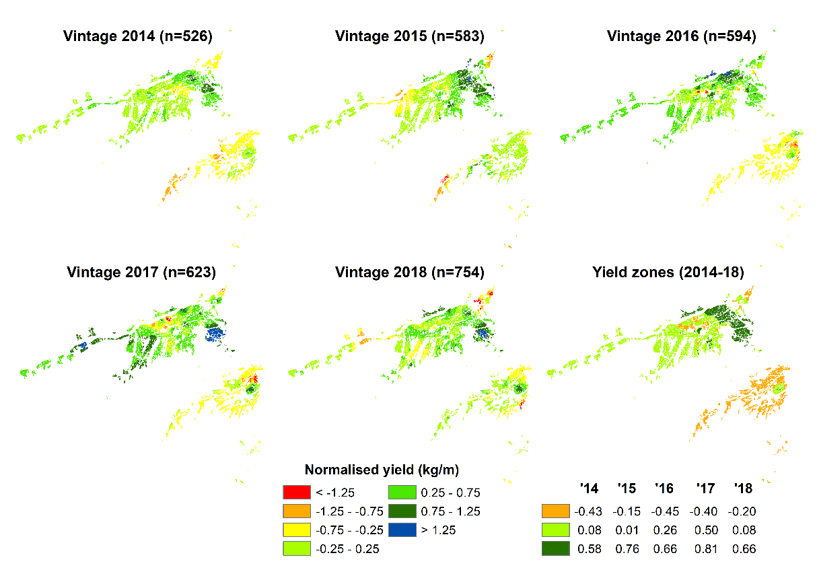
As can be seen in Figure 1a, it does appear that ‘zones’ in the Marlborough region can be identified and classified on yield performance. Thus, the Awatere Valley is characteristically lower yielding than the Wairau Valley, whilst within the Wairau, there is a band of higher yielding vineyards immediately northeast of Blenheim, in an area characterised by siltier soils than occur in the rest of the district. While the maps indicate a general stability in the overall yield differences, some inter-seasonal variation may be occurring, possibly reflecting sub-regional differences in temperatures at key phenological stages (in particular, at flowering).
There also appears to be a very stable pattern in the variation in harvest date (Figure 1b). Areas which are harvested either early or late in the season in one year, tend to be harvested at the same stage in other years, despite seasonal differences in the actual date of harvest.
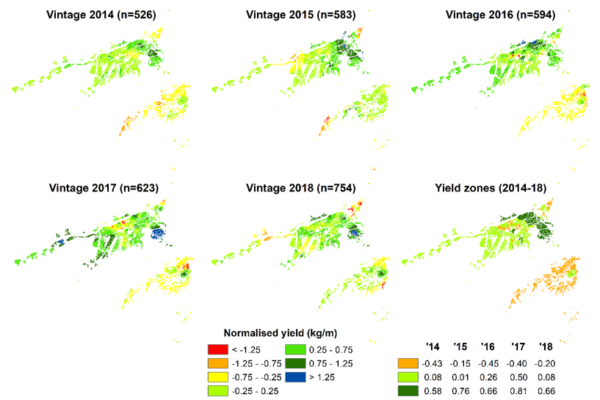
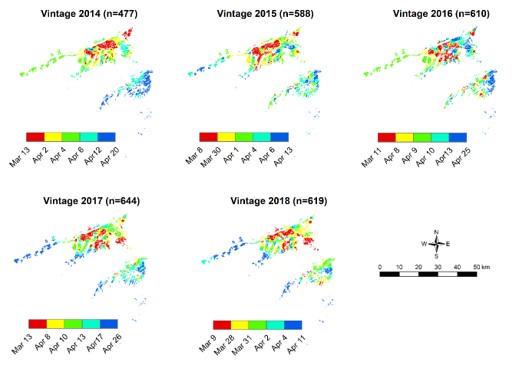
Figure 1. Variation in (a) the yield (kg/m) and (b) harvest date of Sauvignon Blanc within the Marlborough region, 2014-2018. In (a) the yield data were normalised (mean=0, standard deviation of 1) on a per season basis. The map data therefore have units of standard deviations and have been classified such that red is ‘low’, blue is ‘high’ and the average yield lies within the pale green category. Also shown is the result of clustering the maps from each year into ‘yield zones’ to identify areas of characteristic performance. In (b) the first date listed is the earliest date of harvest noted in the dataset for that season; the last date listed is the latest. The data have otherwise been classified so that in each map, 20% of the harvest dates have been assigned to each category; earliest dates are red, and latest dates are blue. ‘n’ denotes the number of data points underpinning each map.
Overall, these new maps are strongly suggestive that Marlborough has areas which are characteristically lower or higher yielding and/or tend to be harvested either earlier or later in the season. This finding is consistent with existing local knowledge.
We are keen to further increase the sensitivity of the maps to clearly differentiate the differences between the ‘zones’. More data will enable us to achieve this – data that is characteristically collected for the purposes of yield estimation. Its confidentiality will be absolutely maintained and the data will only be used for the purposes of generating maps such as those shown in Figure 1.
If you are willing to help with this important project by contributing data, please contact either Bragato Research Institute’s Research Programme Manager, Will Kerner, at will.kerner@bri.co.nz, Mike Trought at mike.trought@gmail.com or Rob Bramley at rob.bramley@csiro.au
We look forward to hearing from you!


