
Vineyard Ecosystems: Soil and Water Services
The Production Footprints Team & friends*, Plant & Food Research
Key Finding
Our leachate data are providing measures of the soils’ regulating service of buffering nitrogen in the rootzone. Nutrient leaching from vineyards is low, and thus viticulture should easily meet regulations that might come from the recently gazetted National Policy Statement for Freshwater Management.
Introduction
The natural-capital concept integrates economic thinking with ecological principles by considering nature’s stocks of materials and energy as capital. In economics, interest flows from financial capital, and by analogy in nature, ecosystem services, which benefit humankind, flow from natural-capital.
In our VE programme we recognise that vineyard ecosystem services are linked to natural capital. We hypothesised that “…the ecosystem services delivered are significantly altered by vineyard practices, and vineyard practices can be designed to enhance vineyard longevity, soil health, and vine performance.”
We are determining the impacts of two different management practices on the delivery of ecosystem services. These are:
- Contemporary vineyards, which use herbicides, pesticides, and synthetic fertilisers. These vineyards maintain an inter-row permanent ground cover
- Future vineyards have a semi-permanent ground cover comprising a wide range of plant species, and use natural products to combat pests and diseases.
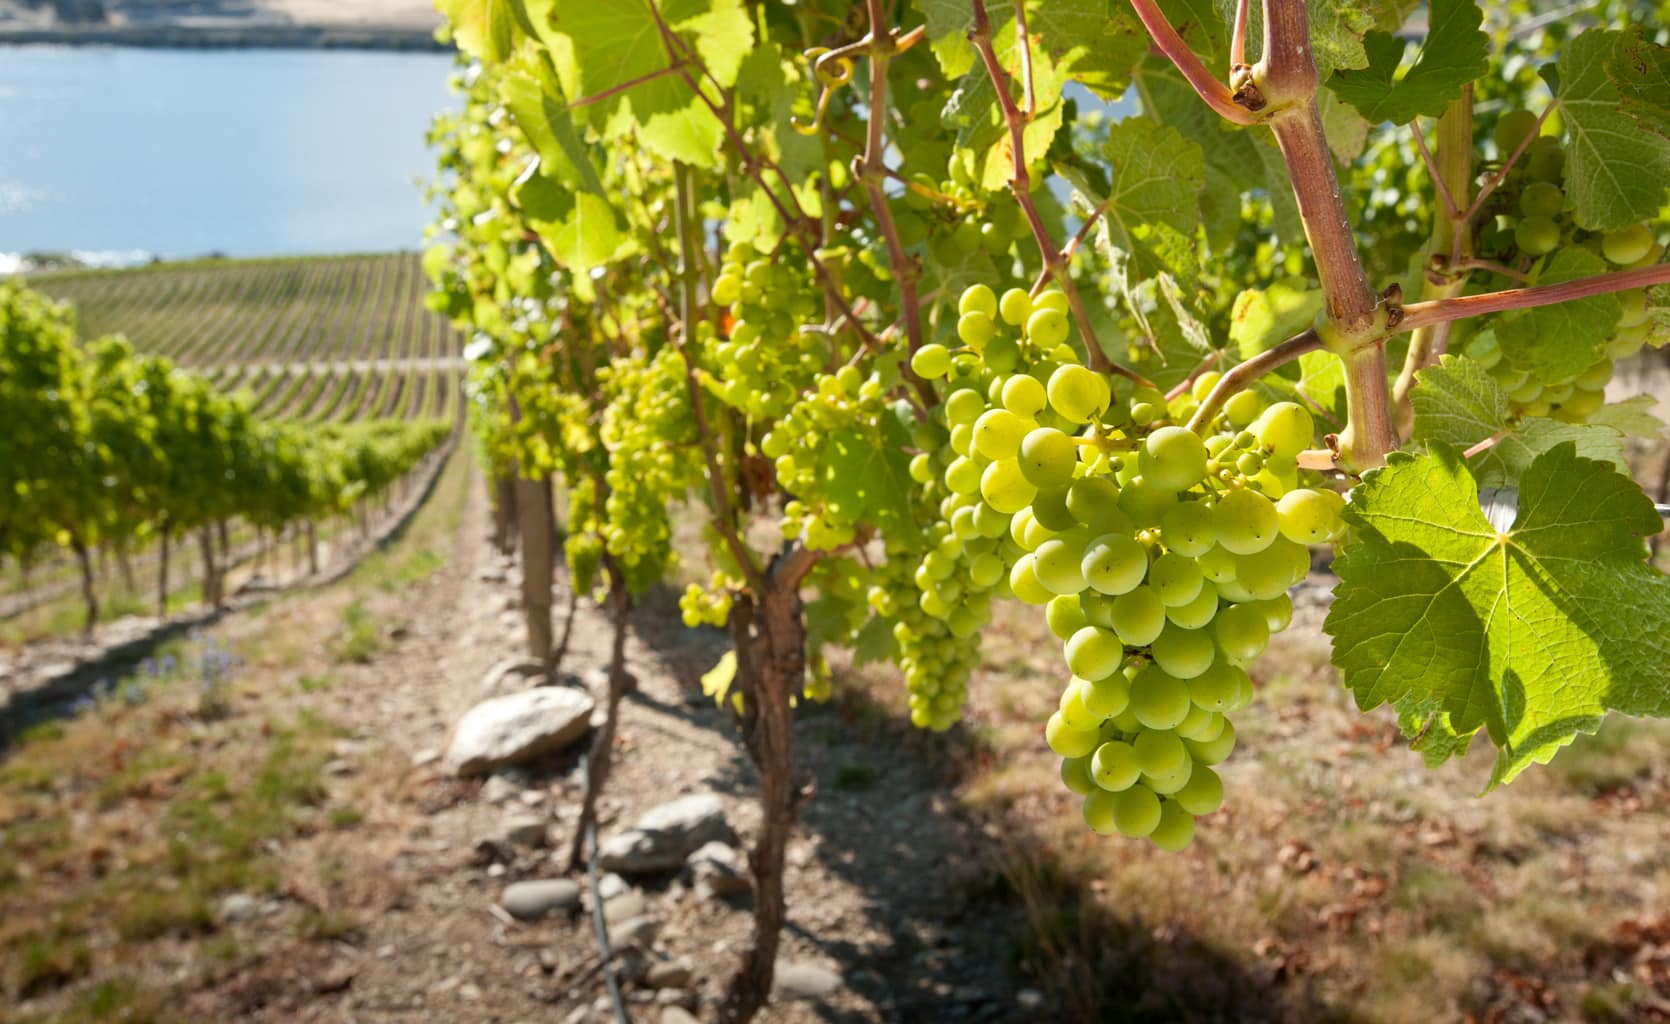
There are four intensively studied “Gold Site” vineyards, all growing Sauvignon blanc, two in Hawke’s Bay and two in Marlborough. In each region, one site is under Contemporary (SBC) and the other under Future (SBF) management.
We discuss the results from the first three years of this VE programme. We describe the natural capital stocks of these sites, and assess the soil and water-regulating services they deliver.
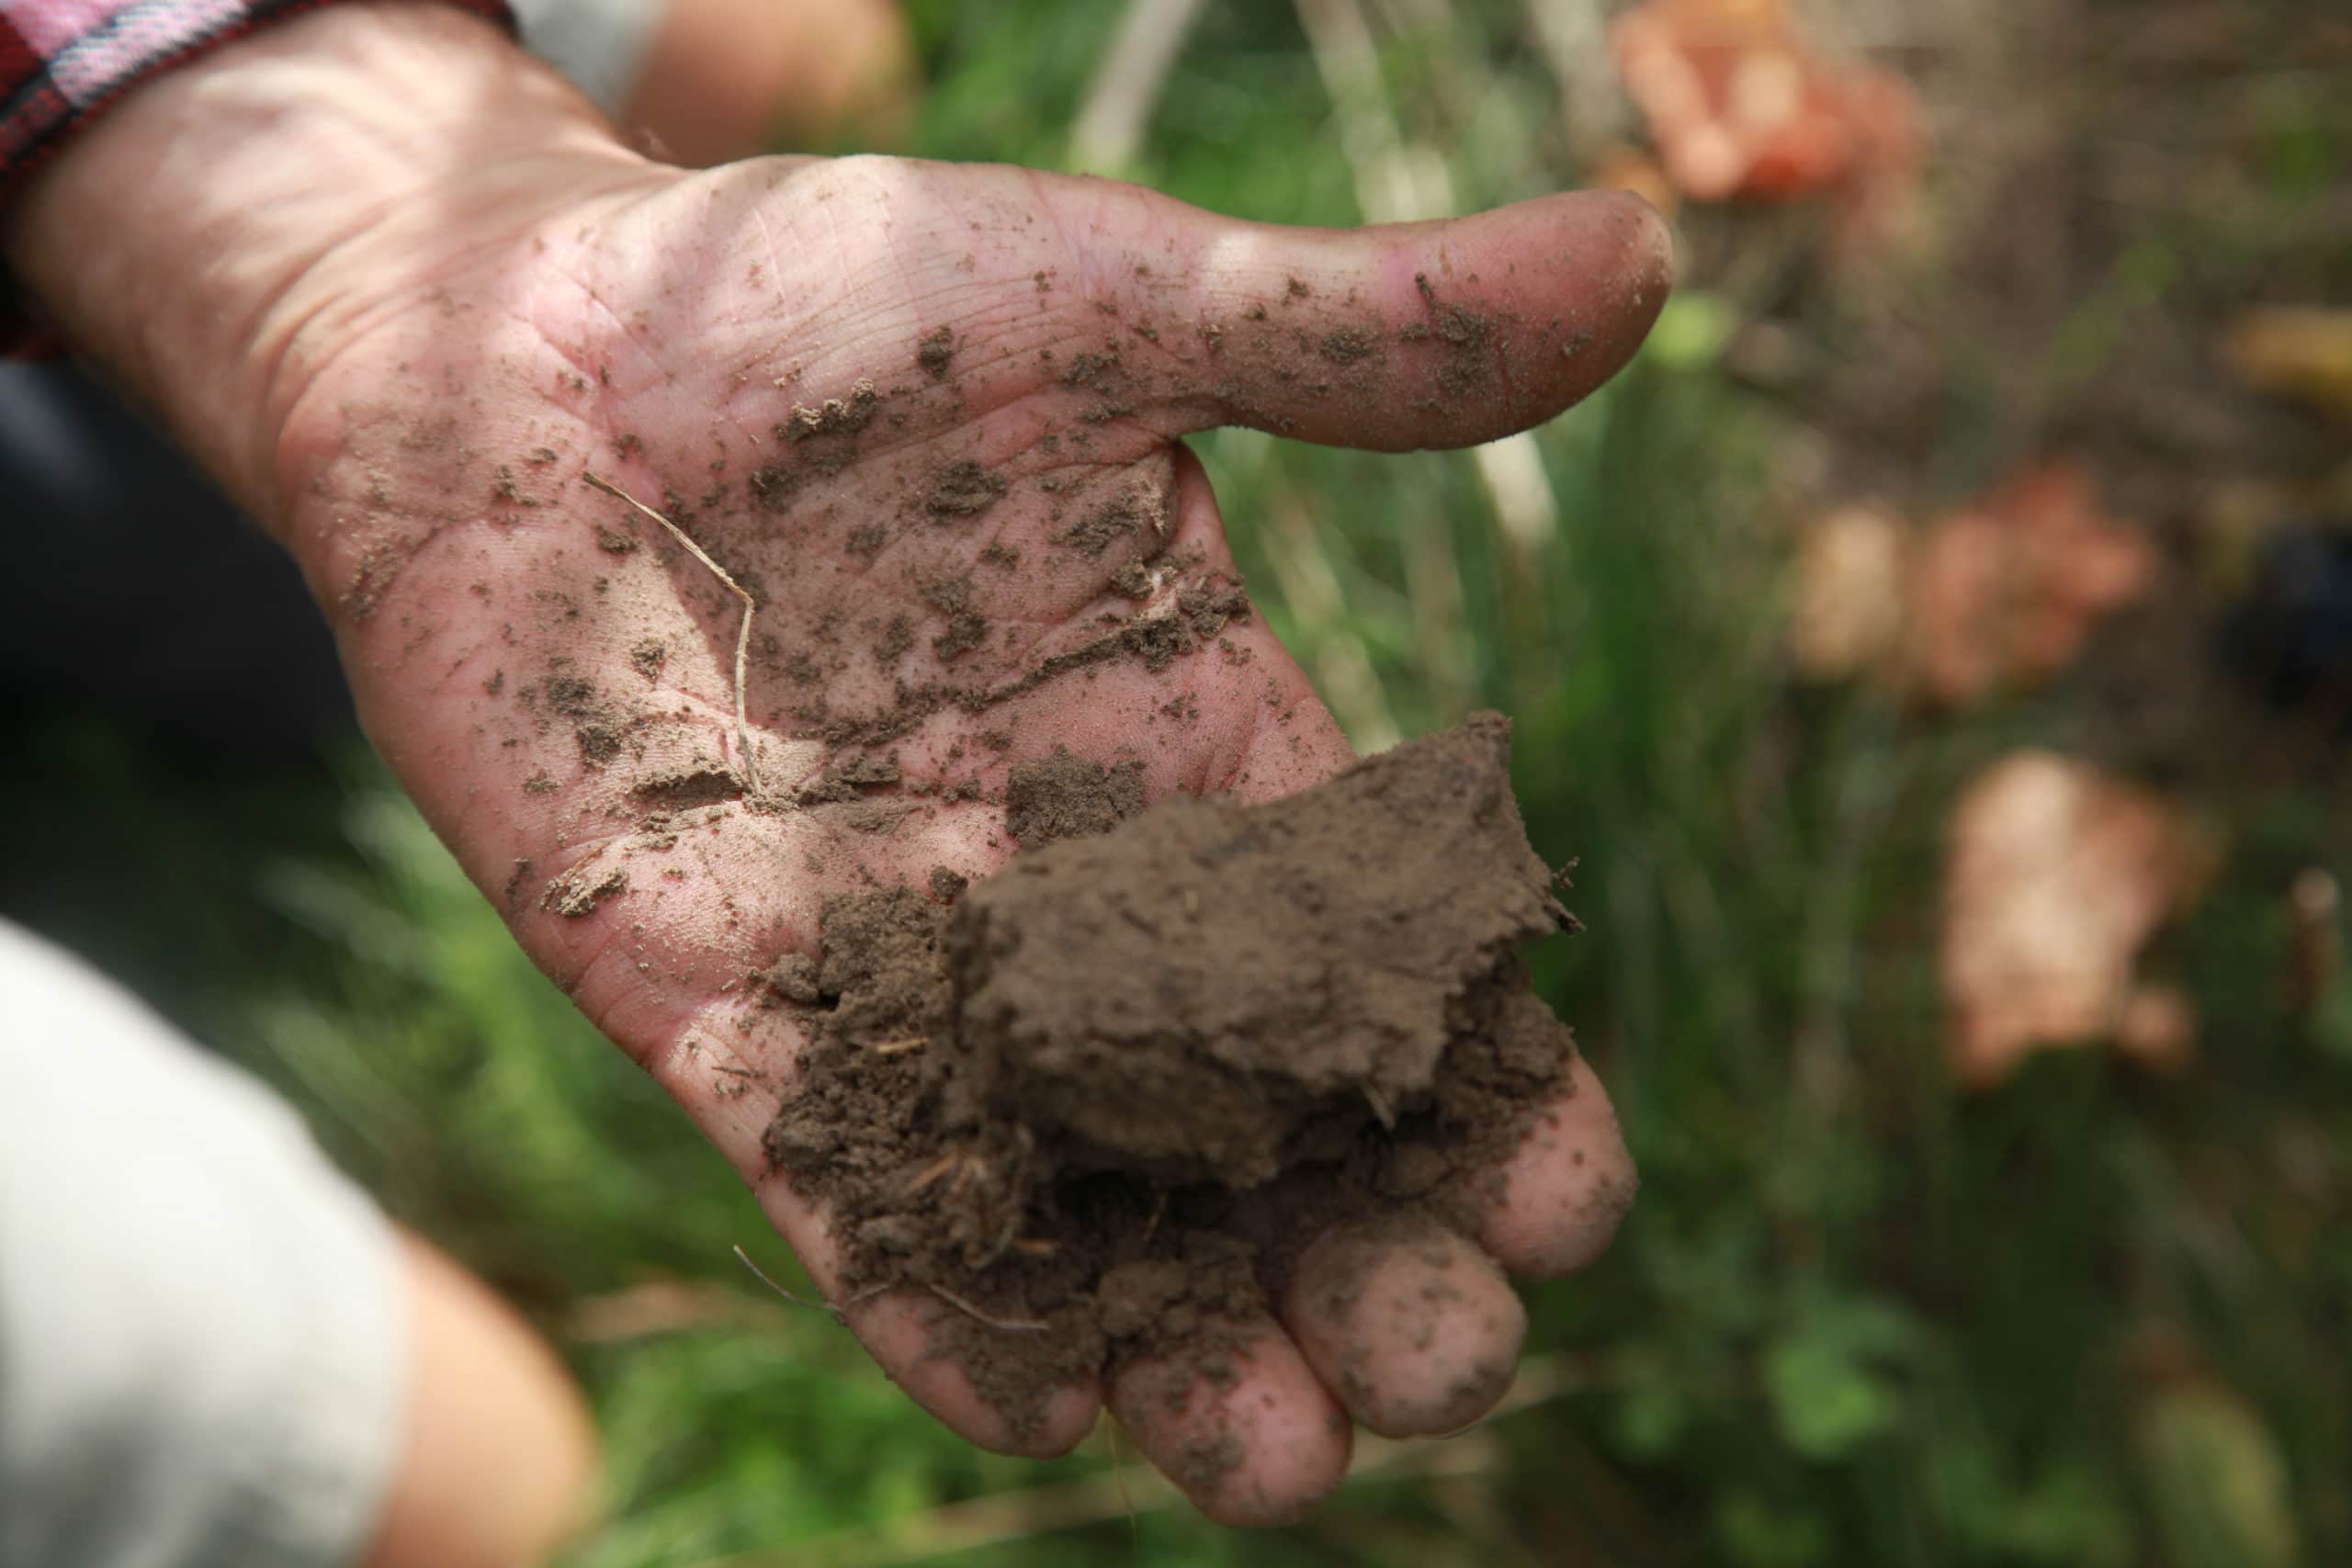
Soil as Natural Capital
The vineyards all have loam soils, with Block 21-SBC having a slightly higher silt content than the others. The two Marlborough vineyards have a higher stone content than those in Hawke’s Bay. Field capacity values are similar (Table 1). Soil macroporosity values are higher for the Future vineyards than for the Contemporary sites. The presence of these large, connected soil pores in the Future vineyards result in different soil-water dynamics.
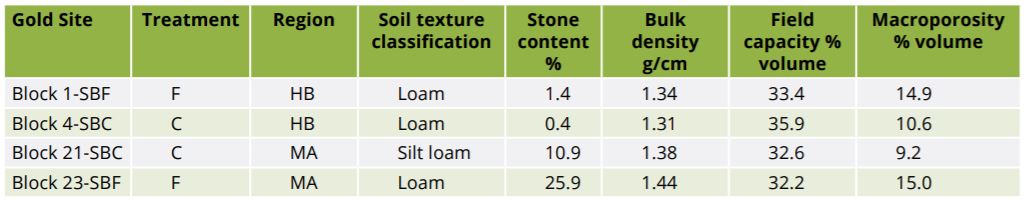
Table 1. Soil properties of the Vineyard Ecosystems Gold Site vineyards in Hawke’s Bay (HB) and Marlborough (MA), under Contemporary (C) or Future (F) sites.
Weather Services across the first 3 years of the Vineyard Ecosystems programme
Terroir is also delivered through the weather services of rainfall, temperature, humidity, wind and sunshine (Figure 1).
Rainfall and irrigation patterns for all four Gold Sites for the first three years are shown in Table 2. The first year (2015-16) does not apply to a full 12 months: our sites were not set up until November 2015. There was great variability between years within each region, and variation between regions in a given year.
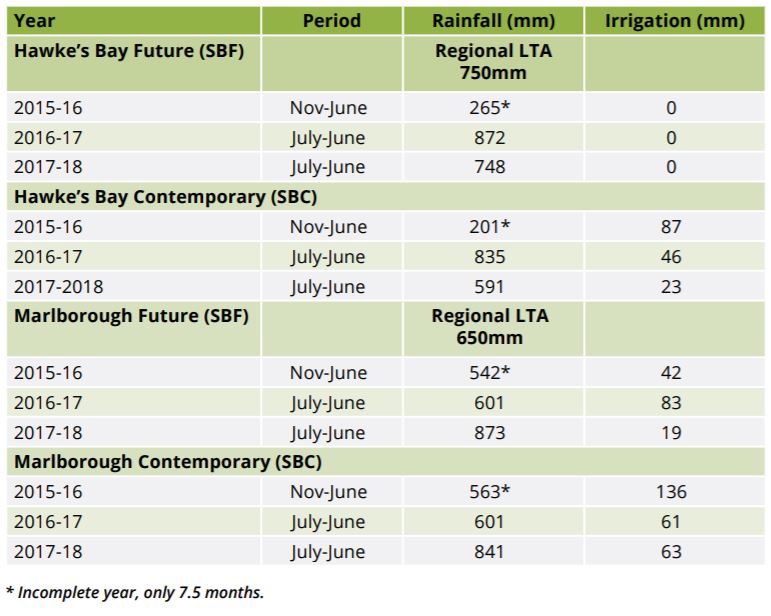
Table 2. Rainfall and irrigation totals over three years at the Vineyard Ecosystems Gold Site vineyards in Hawke’s Bay and Marlborough. LTA is the long-term average rainfall for the region.
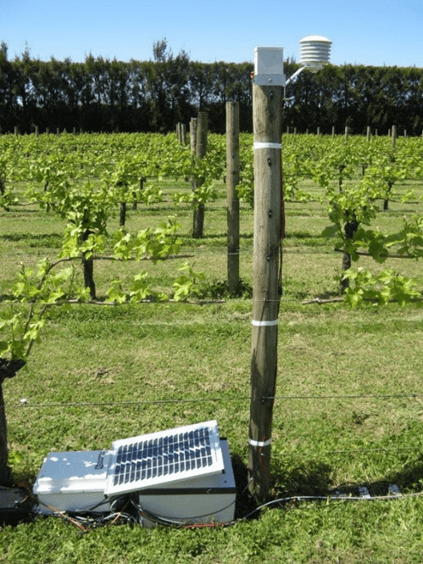
Figure 1. The weather station at the Hawke’s Bay Vineyard Ecosystems Gold Site vineyard (Future). The rain gauge and other sensors are atop the mast. To the right can be seen the Time Domain Reflectometry probes, which measure soil moisture content.
Soil-Water Services across the first 3 years of the VE programme
Time domain reflectometry (TDR) was used to measure the changing pattern of the volumetric soil water content (L/L). Three sets of TDR probes of lengths 0.5 m, 1.0 m and 1.5 m, were used to separate root activity at different depths. We show only the surface 0.5-m results here.
Hawke’s Bay
The Hawke’s Bay SBF site is not irrigated, and the soil-water dynamics are dominated by rainfall (Figure 2, top). The frequent rains during the summer of 2015/16, and the soil’s buffering capacity, delivered a steady pattern of water supply to the vines. Harvest dates are determined by °Brix values, and harvest was 24 March in 2016. The early summer of 2016-17 was very dry, and the soil dried down. Then in late summer some 30 mm of rain fell over 7-8 February, with another 70 mm some ten days later. So from February onwards, the soil water content remained high. The grapes were harvested on 22 March 2017. The 2017-18 year had average rainfall, with steady falls throughout summer, such that the soil moisture content remained constant, except when 83 mm fell on 9 March. Harvest was 16 March 2018.
The Hawke’s Bay SBC site is irrigated. In the first year, irrigation commenced on 12 December 2015, and ceased on 25 March. A total of 87 mm was applied. Harvest was 11 March 2016. The year 2016-17 was wetter than normal, and less irrigation was used. Irrigation commenced on 29 December and was intermittent until 11 January. It remained regular until 17 February when heavy rain arrived. Only 46 mm was applied over the year, about half that of the previous year. Harvest was 20 March 2017. The early summer of 2017 was dry, and irrigation commenced on 30 November. Irrigation was used tactically through until 4 March. Only 23 mm were applied in total, as there was regular rainfall during January and February. The grapes were harvested on 6 March 2018. This tactical use of irrigation resulted in a low seasonal application, averaging just over 50 mm a year.
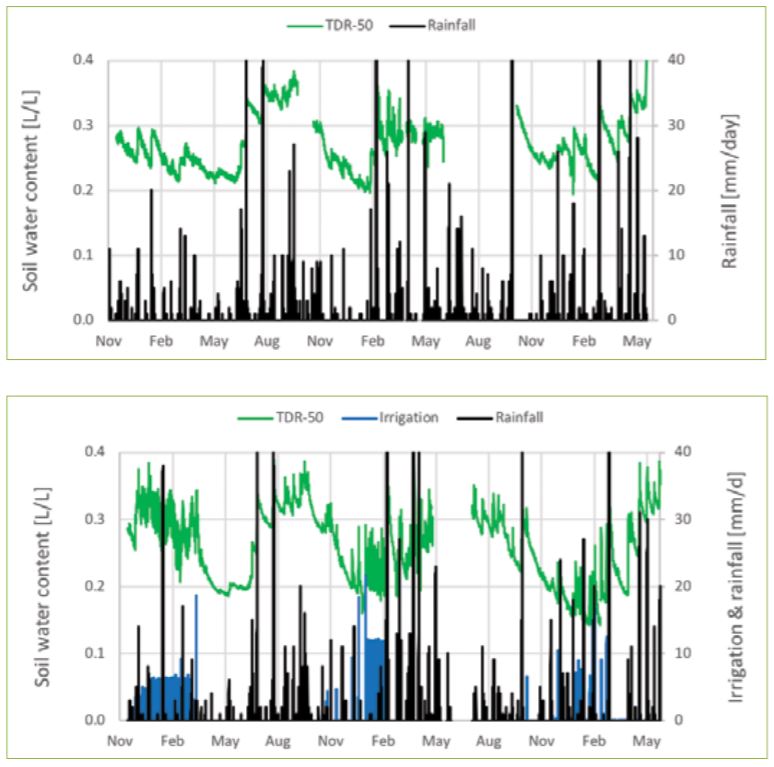
Figure 2. The pattern of rainfall and irrigation in the two Vineyard Ecosystems Gold Site vineyards in Hawke’s Bay, with the pattern of the soil’s changing water content at Block 1-SBF (Future, unirrigated) (upper graph) and Block 4-SBC (Contemporary, irrigated) (lower graph). Here TDR-50 is the soil water content 0-50 cm. The time series runs from November 2015 through until June 2018.
Marlborough
Both Gold Sites in Marlborough are irrigated (Figure 3).
For the Marlborough SBF site irrigation was used tactically. The early summer of 2015 was dry; irrigation commenced on 24 November and continued through until 16 February. Over the season 42 mm were applied, and harvest was 13 April 2016. The 2016-17 year was drier than normal and the amount of irrigation doubled. After several rain events in mid-November, irrigation commenced on 14 December, and finished on 10 March, with 83 mm applied. Harvest was 3 April 2017. The early summer of 2017 was very dry, yet irrigation did not begin until 19 December, and continued only until 4 January. Just 19 mm was applied, the latter part of the season being much wetter than normal, with 30 mm of rain falling on 17 January. Harvest was 31 March 2018.
The Marlborough SBC site uses an irrigation timer that applies 2 mm day-1 to each vine. In 2015, irrigation commenced on 23 November and continued through until 3 May 2016. The grapes were harvested on 31 March 2016. A large total amount of irrigation was applied: 135.8 mm. There may have been an omission to switch the irrigation off. Nevertheless, this rate of just 2 mm day-1 did enable the soil to dry out through January to March. Irrigation over the next two years was much reduced. Irrigation did not commence until 11 December 2016, and again the soil profile dried down through February and March. Harvest was 7 April 2017, and irrigation ceased on 27 April. Season-long, just 61 mm were applied. The 2017-18 year was wet, although mid-summer was reasonably dry. Heavy rains of 56 mm fell over 22-24 March. Harvest was 31 March 2018. Over the season, some 60 mm of water was again applied, and the irrigation was switched off on 5 April.
Apart from SBC in 2015-16, both Gold Sites used only moderate amounts of irrigation. The soil-water monitoring results suggest that better tactical use of water is possible.
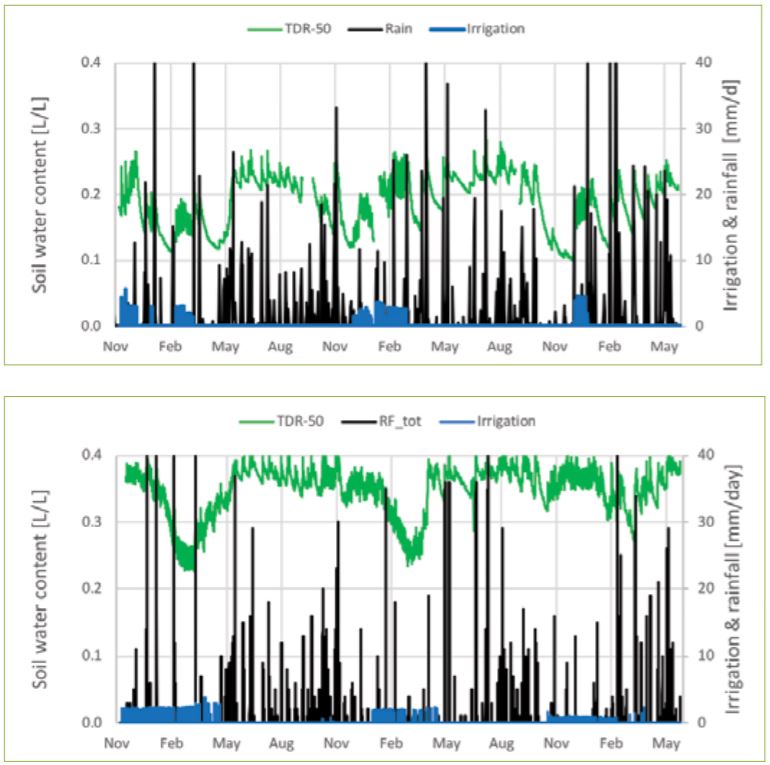
Figure 3. The pattern of rainfall and irrigation in the two Vineyard Ecosystems Gold Site vineyards in Marlborough, with the pattern of the soil’s changing water content at Block 23-SBF (Future, irrigated) (upper graph) and Block 21-SBC (Contemporary, irrigated) (lower graph). Here TDR-50 is the soil water content 0-50 cm. The time series runs from November 2015 through until June 2018.
Nitrogen Leaching and Regulating Services
The soil provides a supporting service by mineralising in situ some of the nitrogen needed for plant nutrition. It also provides a buffering service by storing the mineralised nitrogen, along with any fertiliser. However, soils ‘leak’. Water drains through them. Drainage carries with it nitrogen, which poses a risk to water quality. Our leachate data are providing measures of the soils’ regulating service of buffering nitrogen in the rootzone.
We have developed tension drainage fluxmeters (DFMs) which collect drainage from the base of the rootzone. The 600-mm wick establishes a capillary suction in the soil which is akin to that of the soil’s pores (Figure 4, right). We can quantify the drainage and nutrient losses under the vineyards. The top of the fluxmeter is positioned at a depth of 1.2 m to collect nitrogen leachate at the base of the rootzone.
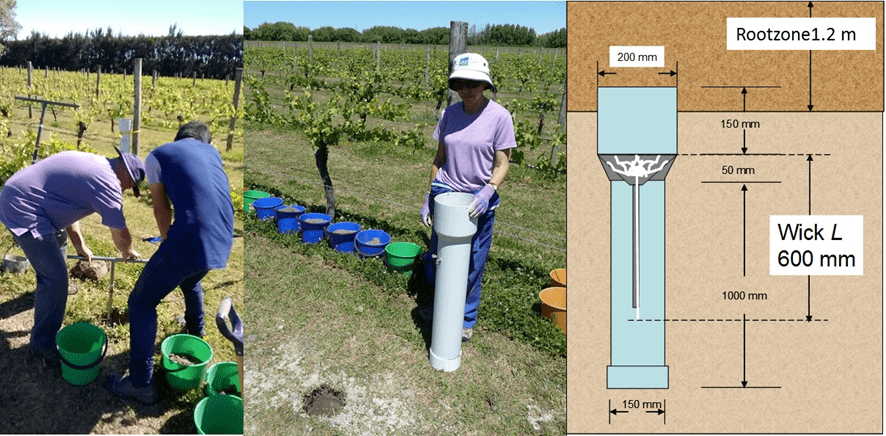
Figure 4. Augering a hole (left) to allow the fluxmeter (centre and right) to be installed in a Hawke’s Bay vineyard. In the middle photograph are the buckets of soil that were collected, and which were then carefully replaced in the correct order once the fluxmeter was lowered into the hole.
Hawke’s Bay
We have not yet completed the leachate analysis for the Hawke’s Bay sites, as many of the DFMs have been flooded by a rise in groundwater caused by impermeable layers deeper in the soil profile. We have, however, recorded the concentration in the perched water table via the DFMs. We will model the drainage rates so that we can then compute the leachate losses. This work is currently underway.
Marlborough
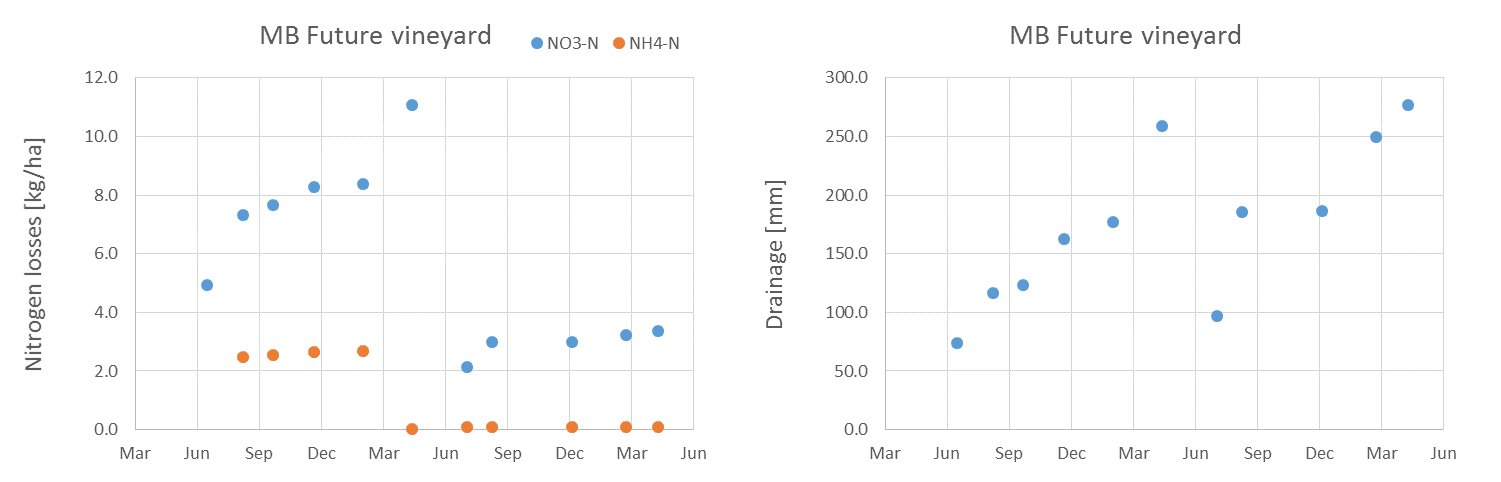
The cumulative drainage totals for the two sites in Marlborough for 2016-17 and 2017-18 were 200-250 mm, being 30-40% of the annual rainfall (Figure 5, right). This drainage is a valuable regulating service, as it recharges groundwater.
The soils are close to field capacity from June until September (Figure 3). Thus, most of the drainage occurs during winter. We observed slightly more drainage under the Future vineyard, partly because of the soil’s greater stone content and higher macroporosity (Table 1).
The cumulative nitrate leaching over 2016-17 was 12 kg-N ha-1 y-1 at the SBF site and 10 kg-N ha-1 y-1 for the SBC site (Figure 5, right). The 2017-18 ‘leaching season’ is still underway. The nitrogen leaching totals are low, especially in comparison to those of other land-uses (Green et al. 2012). Viticulture should easily be able to meet any regulations that will come through the implementation of the recent National Policy Statement for Freshwater Management.
![Two graphs titled "MB Contemporary Vineyard." Left graph: Nitrogen losses [kg/ha] with orange dots for NH4-N and blue for NO3-N, showing occasional spikes. Right graph: Drainage [mm] with blue dots, indicating varying values across May to April.](https://bri.co.nz/wp-content/uploads/2020/08/17_104-Fig5b.png)
Figure 5. The pattern of nitrogen loss (NO3-N is nitrate; NH4-N is ammonium) at the two Vineyard Ecosystems Gold Site vineyards in Marlborough, along with the measured drainage at Block 23-SBF (upper graph) and Block 21-SBC (lower graph). The time series runs from May 2016 through until May 2018.
This article first appeared in the December 2018/ January 2019 issue of the New Zealand Winegrower magazine.
* Steve Green, Roberta Gentile, Karen Mason, Carlo van den Dijssel, Robert Simpson, Victoria Raw, Marc Greven, Vaughan Bell, Nathan Arnold, Isabelle Sorensen, Jian Liu, & Brent Clothier. Contact: brent.clothier@plantandfood.co.nz